For small business owners, managing costs and finding ways to lower expenses are among the most important skills to have.
Finding market data can be hard and expensive. Market data is difficult to obtain because it is often dispersed across multiple sources and platforms.
Additionally, the data may be tough to extract and organize in a usable format.
Furthermore, obtaining high-quality market data can be costly and the fees associated are often times unnecessary.
This amounts to a tall task and we haven’t even gotten our hands on any data yet. Luckily for us, there is two words that speak massive volumes to a small business owner: open-source. (For those not in the loop, open-source means free!)
And would you look at that? Python is open-source!
Python is a great choice for web scraping market data because it has a wide range of libraries and modules that make it easy to handle the various tasks involved in web scraping, such as connecting to websites, parsing HTML, and storing data.
BeautifulSoup, in particular, is a powerful library for parsing HTML and XML, which makes it easy to extract specific information from webpages.
Scraping
To begin, we will first need to target which website to scrape. There are many popular websites to scrape from, like Amazon or eBay. For my example, I will be using a book website.
To start our code, we first load in the libraries we need.
import requestsfrom bs4 import BeautifulSoupimport csv
For my example, we will be using 6 different libraries, starting off with the 3 here: requests, BeautifulSoup, and csv.
Next up, we want to store the target URL of the website we intend to scrape. We can do this with the following code:
url = "https://books.toscrape.com/"
After we do that, we are ready to start scraping the website. BeautifulSoup is a wonderful Python library that makes it simple to parse through a websites HTML.
To leverage BeautifulSoup, we must first use the requests library so BeautifulSoup knows what to parse.
response = requests.get(url)response.encoding = 'utf-8'
It’s important to make sure the data is being read with UTF-8 encoding, as we may run into errors later without it.
Following that, we let BeautifulSoup do its magic.
soup = BeautifulSoup(response.content, "html.parser")items = soup.find_all("article", {"class": "product_pod"})
Success! You have now scraped your first website.
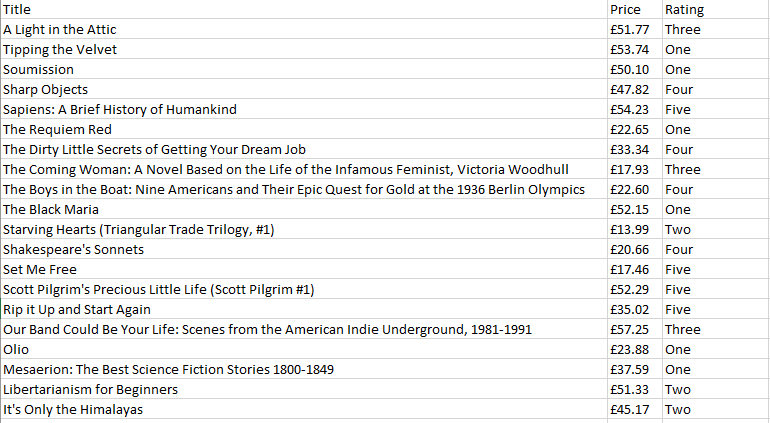
Now it is time to get this data into a working format, this is where our csv library comes in handy. This library allows us to take what BeautifulSoup has parsed and store it in a csv file ready for excel.
with open("books.csv", "w", newline="",encoding='utf-8') as f: writer = csv.writer(f) writer.writerow(["Title", "Price","Rating"])
This is the first section of our code using the csv library, where we define the column names.
Next, we decide how to populate those columns:
for item in items: title = item.find("h3").find("a")['title'] price = item.find("div", {"class": "product_price"}).find("p", {"class": "price_color"}).text rating = item.find("p", {"class": "star-rating"})['class'][1] writer.writerow([title, price, rating])
Our Result:

And there we have it! We have successfully scraped market data for $0. Now to move onto some data management and a quick analysis.
Data Management
Since we are overachievers, we do not manage data in Excel.
*shutters*
We are already in Python, we will continue our analysis there. Let’s leave the spreadsheets to our management overlords.
To start off our analysis, we need to load in some libraries:
import pandas as pdimport seaborn as snsimport matplotlib.pyplot as plt
The 3 we use here are my personal favorite libraries of any language: pandas, seaborn, and matplotlib.
With that, we want to start performing data management using pandas.
df = pd.read_csv("books.csv")df["Price"] = df["Price"].str.replace("£", "")df["Price"] = pd.to_numeric(df["Price"])
You may have noticed that I remove the British Pound sign, this is out of habit and I’ve never experimented with it’s effects on graphing. We also want to make sure our price column is numeric, as our other variables are categorical.
Finally, we update the csv file:
df.to_csv("books.csv", index=False)
Analysis
The analysis section will be brief, as there are many tutorials out there on graphing in Python. This will give you an idea of the visualizations you may want to do from your scraped data.
To quickly analyze this data, I made a bar chart in seaborn to compare a book’s 5-star rating to the price.
sns.set_theme(style='darkgrid')sns.barplot(x="Price", y="Rating", data=df)plt.xlabel("Price")plt.ylabel("Rating")plt.title("Book Rating Distribution")plt.show()
Our Result:

Conclusion:
First, we found a target website that we wanted to scrape.
Next, we used Python in order to scrape the target website.
From there, we stored the data in a workable csv file.
Finally, we continued our analysis and data management in Python.
I hope that you found this article insightful and enjoyable! Thanks for reading :)
Nick
Remarks:
Not financial advice. You should seek a professional before making any financial decisions.